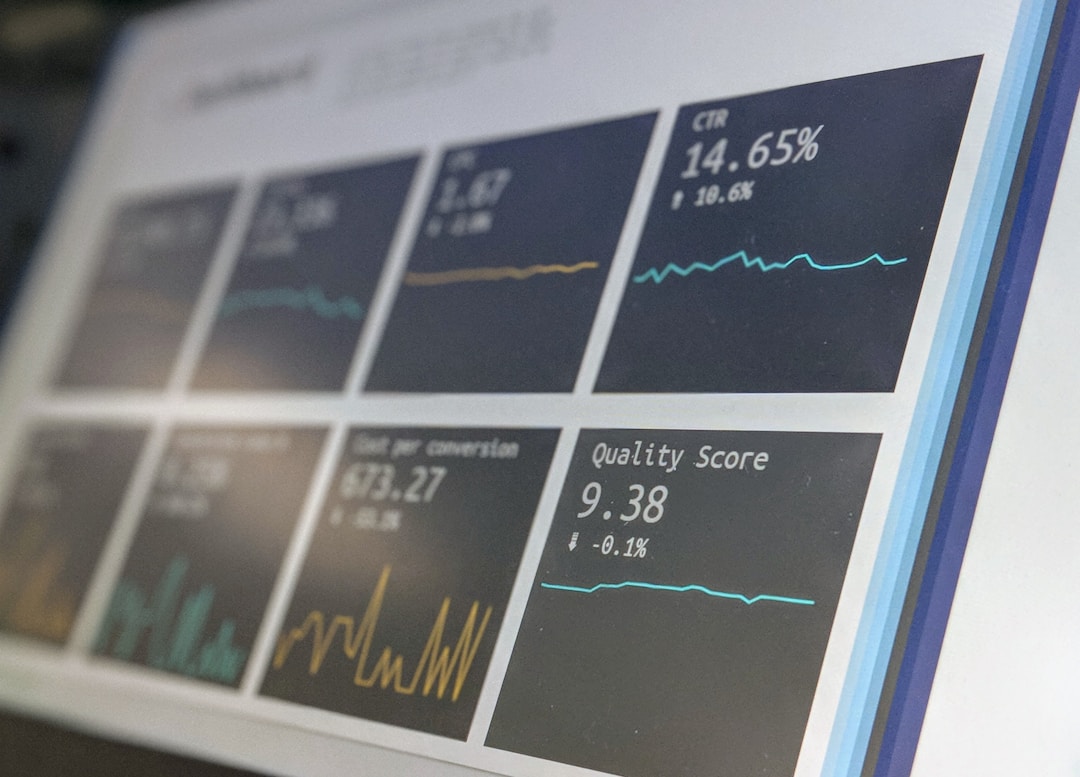
Digitally forward organizations recognize the central role of data in decision-making. However, the real power lies not just in data collection but in how we use that data to support our commercial decisions, policy-making, or operational efficacy. The key to leveraging these benefits is visual data representation, also known as data visualization. In this article, we will delve into the importance of data visualization, explaining how it can foster engagement, improve understanding, and facilitate evidence-based planning to meet your business’s strategic objectives.
Embracing the Art of Data Storytelling

For data to be meaningful, it must tell a story. Data storytelling is the practice of building a narrative around a set of data and its accompanying visualizations to help convey the meaning of that data in a powerful and compelling way. Data storytelling can be a valuable tool for businesses, as it allows various narrative elements to be added to data visualizations, making them more engaging and easier to understand.
This technique can be helpful in a broad range of scenarios such as sales presentations, business meetings, and strategic planning sessions. Data storytelling blends the power of charts and graphs with a strong narrative. This combination allows the audience to connect with the data on an emotional level, making the insights provided by the data more impactful.
The Power of Data Visualization
Data visualization, by definition, involves the presentation of data in a pictorial or graphical format. It allows decision-makers to see analytics visually so they can understand thorny data concepts or identify new patterns. Using human visual perception to present data is a natural way to capitalize on our cognitive tendencies toward pattern and relationship identification.
When done right, the potent combination of scientific data with visual elements can translate complex datasets into graphical representations, cutting through the clutter to reveal the crystal-clear insights underneath. Now, you might be wondering, what types of visualization could you use? Indeed, there are several data visualization formats, ranging from line, bar, and pie charts to inventive geospatial heatmaps. Let’s take the histogram, for example; this simple, yet powerful, visual tool can help businesses view data distributions over a period.
This tangible application reflects just how imperative it is to not only visualize your data but also to make it as engaging and accessible as possible. After all, data visualization is about more than creating pretty charts; it’s about enabling a business to recognize its data in new ways and to make informed decisions accordingly.
Promoting Data-Driven Decision-Making
Making decisions based on data-derived insights is no longer just a preference: it’s a necessity for modern businesses wishing to remain competitive. Data visualization can play a crucial role in this process as it allows complex data to be understood and analyzed at a glance. Without it, valuable insights that might be hidden in the data can go unnoticed, leading to less-informed decisions and a possible loss of competitive advantage.
Through the application of modern data visualization techniques and tools, even complex datasets can be transformed into easily understood visual representations. This allows for more informed decision-making, with a clearer understanding of each decision’s potential outcomes and impacts.
The Role of Technology in Data Visualization

Data visualization didn’t just stumble onto the scene. It has been catalyzed by the rapid advancements in technology. The explosion of big data, coupled with advancements in computational prowess, has allowed data visualization to evolve from static graphs to interactive visualizations.
Modern visualization technologies allow real-time reporting, where data streams feed into dynamic visualizations that update as data changes. This instantaneous visualization helps businesses stay agile, providing them with actionable insights available at a moment’s notice. Interactivity also comes into play, with users being able to manipulate data and customize views according to their needs.
Altogether, organizations need to unlock the power of data visualization as it paints a picture that mere numbers cannot denote. Done well, it helps simplify complex datasets, tells a clear and compelling story, empowers data-driven decisions, promotes effective communication, and enhances productivity. In this evolving world, the power of visual data is extraordinary and infinite; the question is whether or not businesses are ready to seize it.
